
Introduction
Coronary artery disease (CAD) continues to be the leading cause of death in most developed countries and much of the developing world in spite of increased awareness and treatment of individuals at risk. Every day in South Africa, approximately 80 people die of myocardial infarction or heart failure, while another 60 die due to stroke. This statistic reflects a lack of prevention, early detection and effective management of cardiovascular risk factors. The role of lipids and lipoproteins in atherogenesis has been demonstrated by numerous studies but the methods for assessing CAD risk have continued to be the subject of much debate.
More Info
Serum cholesterol travels through the blood stream within lipoproteins, of which the two most abundant are low-density lipoprotein (LDL) known as “Bad Cholesterol” and high-density lipoprotein (HDL) known as “Good Cholesterol”. LDL carries cholesterol from the liver to peripheral tissues, while HDL carries cholesterol back to the liver for excretion or recycling.
Determining the risk of cardiovascular disease (CVD) and CAD has traditionally included the measurement of a patient’s total cholesterol and HDL-cholesterol. These two numbers are then used to calculate the levels of LDL-cholesterol. Triglycerides are also measured.
However, studies have found that more than 75% of patients with an acute coronary syndrome or myocardial infarction (heart attack) have normal blood values of cholesterol, LDL-cholesterol and HDL-cholesterol. Similarly, some individuals with elevated LDL-cholesterol do not develop heart disease. Patients and their physicians may not know their true risk of having a heart attack simply by measuring “good” and “bad” cholesterol, thus delaying appropriate preventative action because of this serious lack of information.
In light of these findings a test was developed to assess the different lipoprotein fractions. The test has FDA approval and this test is now available in South Africa – referred to as the LipidPro test.
LipidPro analyzes all lipoprotein fractions and subfractions in an individual’s blood. LipidPro provides physicians with advanced and comprehensive lipoprotein analysis used for more specific screening and treatment decisions as well as for monitoring patients at increased risk for coronary heart disease (CHD).
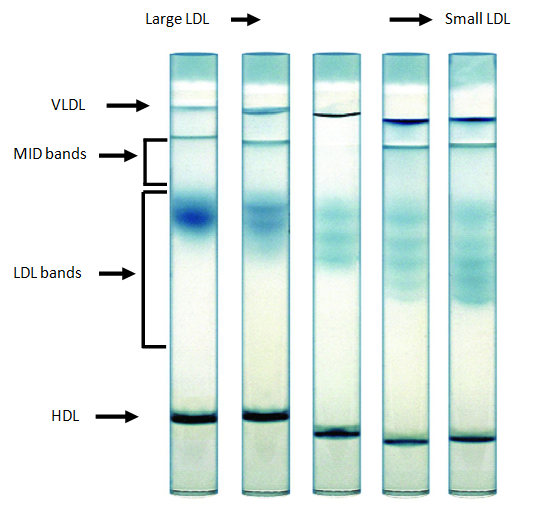
Figure 1: Image of gel tubes after electrophoresis showing the various lipoprotein subfractions ranging from large, buoyant LDL cholesterol (left) to small, dense LDL cholesterol (right)
LipidPro LDL
Not all LDL cholesterol is created equal. LDL-cholesterol consists of particles that vary in size, density and chemical compositions as well as in physiologic properties and atherogenic potential.
Large, buoyant LDL (subfractions 1 and 2) represent the “good” LDL responsible for the transport of cholesterol to peripheral tissues for cell membrane maintenance, bile acid synthesis by the liver and for the production of steroidal hormones. It is the small dense LDL, however, that are prone to oxidation, and are demonstrated by multiple clinical studies to be an independent risk factor for cardiovascular disease. Small dense LDL is a component of the lipid triad associated with atherogenic dyslipidemia (the other two components being increased plasma triglyceride levels and decreased HDL-cholesterol concentrations). Predominance of small dense LDL increases the risk of CVD by 3-fold even at “normal” concentrations of LDL cholesterol.
LDL particle size and density are influenced by genetics, diet and body weight — and dietary interventions have demonstrated measurable effects. LipidPro LDL provides a colour coded profile that measures up to 12 lipoprotein fractions and subfractions. Elevated Mid B, Mid C and small-dense LDL 3 to LDL 7 pose the highest risk for CVD (as shown by images below). The detailed analysis assists health practitioners with identifying individuals requiring dietary or medical therapy and lifestyle changes, the success of which can be measured through retesting after a 3 month period of therapy.
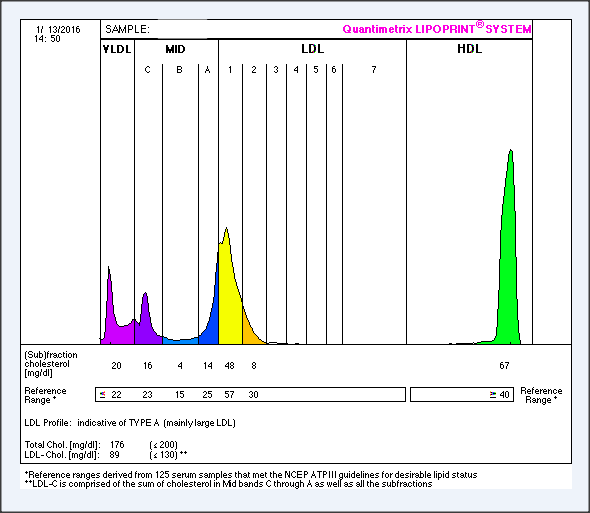
Figure 1: Type A profile (predominantly large LDL present)
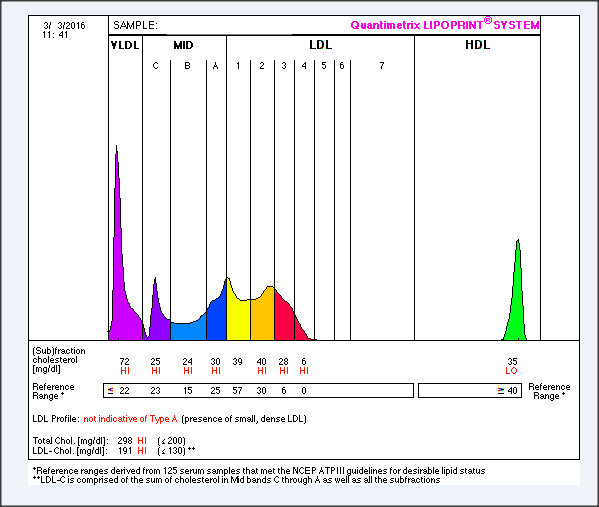
Figure 2: Not Indicative of Type A profile (predominantly small-dense LDL present shown in subfractions 3 to 7, 3 x increased risk for atherogenesis)
References:
- Klug EQ et al (2015). South African Dyslipidaemia Guideline Consensus Statement. South African Family Practice; 57(2):22-31
- Castelli WP (1998). Cholesterol and lipids in the risk of coronary artery disease – The Framingham Heart Study. Can J Cariol; (Suppl A): 5A-10A.
- Castelli WP (1992). Epidemiology of triglycerides; a view from Framingham. Am J Cardiol; 70: 43-49.
- Catelli WP (1998). The new pathophysiology of coronary artery disease. Am J Cardiol; 82(Suppl 2): 60-85.
- Carmena R et al (2004). Atherogenic Lipoprotein Particles in Atherosclerosis. Circulation;109[suppl III]:III-2–III-7.)